
Inflation continues to steal the stage this past month not only affecting prices at the pump and grocery stores, but spreading into housing and auto sales to name a few. The Federal Reserve (The Fed) has attempted to combat the rise with two interest rate hikes so far this year and with more expected until inflation is more in line with its 2% target. The latest Consumer Price Index (CPI) number reported last week (8.3%) showed the first deceleration of inflation in months, but not at the rate of expectations (8.1%). Core inflation — which excludes costs for groceries and gas — increased 0.6% in April from March, faster than 0.3% increase in March. That measure is especially important for policymakers, who use it as a gauge to help determine the pace of inflation.1
After setting a record closing high of 4,796 in early January, the S&P 500 declined by 17.54% at the market close on May 12, 2022. Concerns about rising interest rates, rising inflation, Federal Reserve tightening, and the risk of a recession have all weighed on the stock market. The good news is that first quarter earnings reports are generally strong and Wall Street analysts are estimating that S&P 500 earnings will increase 10% in 2022 and 9.6% in 2023.
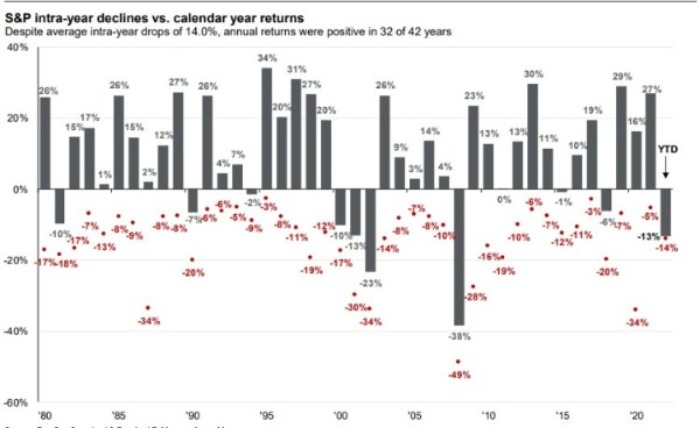
While we have seen a resurgence of stock market volatility over the last few months it is not an uncommon scene we have lived through before. As you can see in this chart2, the declines that we are experiencing this year are similar to those in the past. While the S&P 500 has experienced an average 14% intra-year decline over the last 42 years, the Index has ended in positive territory in 32 of those years or 76% of the time. More than likely volatility will remain until the outcome of the Federal Reserve’s fight against inflation becomes evident.
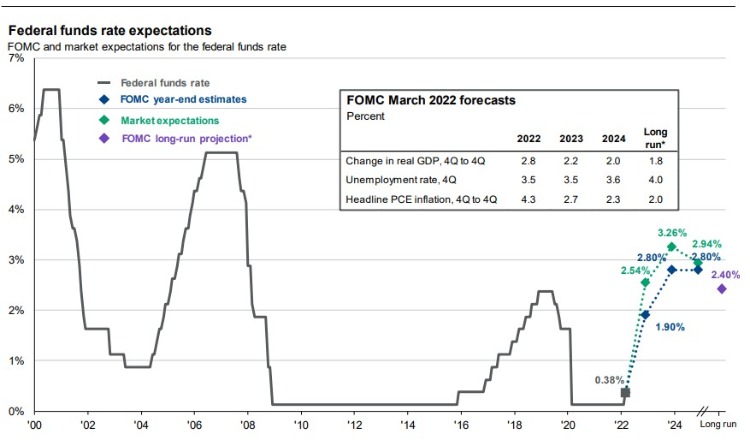
The challenge facing the Federal Reserve is attempting to slow inflation and cool down the job market while not pushing the U.S economy into a recession. The Federal Reserve recently approved the largest rate increase since 2000 as it increased the federal funds rate by a half percentage point to target a range between 0.75%-1%. Chair Powell has already signaled that a 0.50% rate hike is likely at the Fed’s next meeting in mid-June. The Fed will also begin shrinking its balance sheet and has announced that it will allow bonds to mature without reinvesting the proceeds into new securities. They will begin to reduce the balance sheet by $47.5 billion in June, July, and August. After the initial three month period this amount will increase to $95 billion in the longer term.3
U.S. payrolls grew by a higher than expected 428,000 in April with the unemployment rate holding steady at 3.6%. The tight job market is putting upward pressure on hourly wages which increased 5.5% from a year ago. Non-farm payrolls are down by only 1.2 million from their level in February 2020. The tightness in the labor market, along with increasing hourly wages may make it more difficult for the Fed to bring inflation to a reasonable level. However, an increase in the labor force (labor force participation) could help the Fed keep hourly wage growth in check, which in April was 62.2% versus 63.4% in February 2020.4
Stock market volatility increases often trigger media stories that make it sound like the difficult market will never end. This grim temporary outlook may increase investor anxiety and create uncertainty. However, it is important to remember that the markets have been historically resilient and letting emotions drive investment decisions often prove costly. While you don’t want to ignore the current market environment, it is also important to think clearly and confirm that your long-term investment strategy is still appropriate for your unique situation and allows you to achieve the financial goals that you have established.
1 NY Times, 5.11.22
2 Source: FactSet, Standard & Poor’s, J.P. Morgan Asset Management. Returns are based on price index only and do not include dividends. Intra-year drops refers to the largest market drops from a peak to a trough during the year. For illustrative purposes only. Returns shown are calendar year returns from 1980 to 2021, over which time period the average annual return was 9.4%. Guide to the Markets – U.S. Data are as of April 30, 2022.
3 Source: Bloomberg, FactSet, Federal Reserve, J.P. Morgan Asset Management. Market expectations are based off of the respective Federal Funds Futures contracts for December expiry. *Long-run projections are the rates of growth, unemployment and inflation to which a policymaker expects the economy to converge over the next five to six years in absence of further shocks and under appropriate monetary policy. Forecasts are not a reliable indicator of future performance. Forecasts, projections and other forward-looking statements are based upon current beliefs and expectations. They are for illustrative purposes only and serve as an indication of what may occur. Given the inherent uncertainties and risks associated with forecast, projections or other forward-looking statements, actual events, results or performance may differ materially from those reflected or contemplated. Guide to the Markets – U.S. Data are as of April 30, 2022.
4 Department of Labor


