
A topic that continues to come up in many discussions is the status of the current housing market. People are starting to ask, “Are we on the brink of another housing collapse?” Memories of the 2006 collapse are front of mind for investors. While every situation is different, the comparisons of then versus now are worthy of discussion and something we continue to monitor given its effect on the overall economy and markets.
The housing market in the United States is ultimately a collection of local and regional markets, driven by the economic pillars of supply and demand, along with characteristics that influence that market uniquely. While the market grapples with the latest pressing issues – direction and magnitude of interest rates, inflation, supply chain, Covid, and the Russian invasion of Ukraine – the housing market remains an important variable that will prove insightful as to the direction and health of the economy.
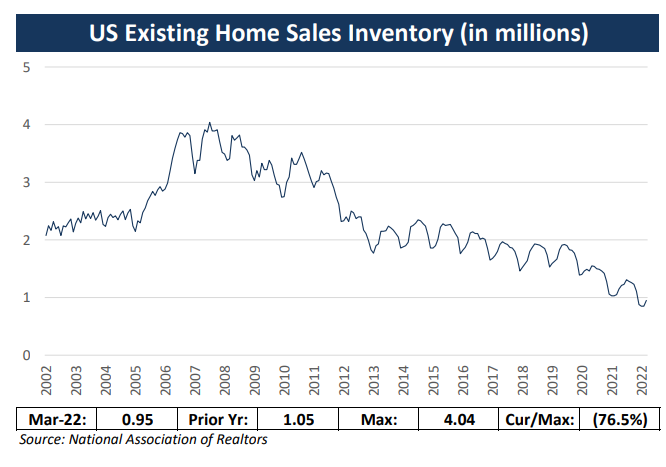
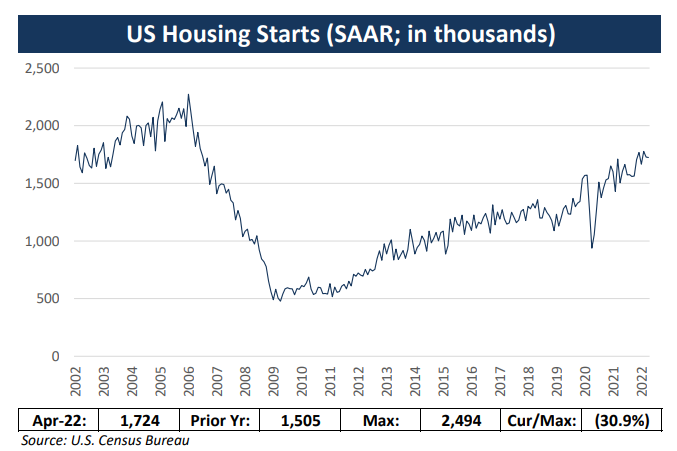
Real estate experts remind us that there is simply no supply available. As we can see from the two charts1 , both existing home sales inventory and level of housing starts are at levels that many would suggest indicate a tight supply. In fact, when one looks at inventory from a month’s supply perspective, the U.S is at a 20 year low of about 2 months. Certainly, these metrics look a lot more favorable compared to 2006, and housing experts suggest we are under-supplied by 1.5-3 million units of housing today.
Housing demand generally remains robust, driven by strong employment levels. At its core, desire to own a home remains solid with home ownership rates ticking up from their lows in 2016. These rates are not near the frenzy we saw in 2006 when home ownership rates peaked, close to 70%. One interesting aspect related to demand is that household formation has continued to trend down, reaching lows last seen in the 1940s. Affordability, a key element of housing demand, reveals interesting insights.
A key question in the housing equation is whether or not individuals have the ability to purchase a new or existing home. Imbedded in this equation are numerous factors, including employment, wealth and wage levels, mortgage rates, and the level of median housing prices. 2
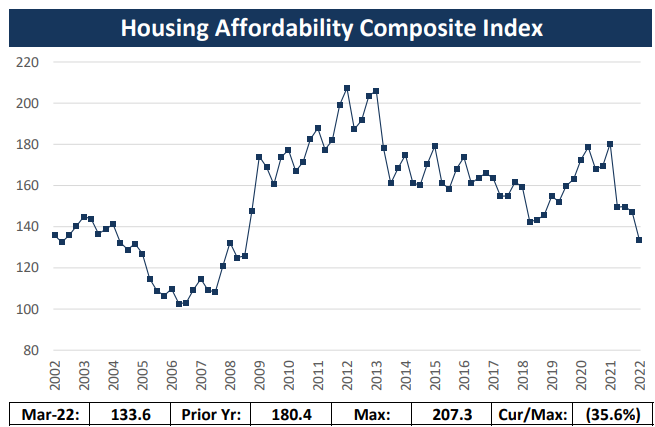
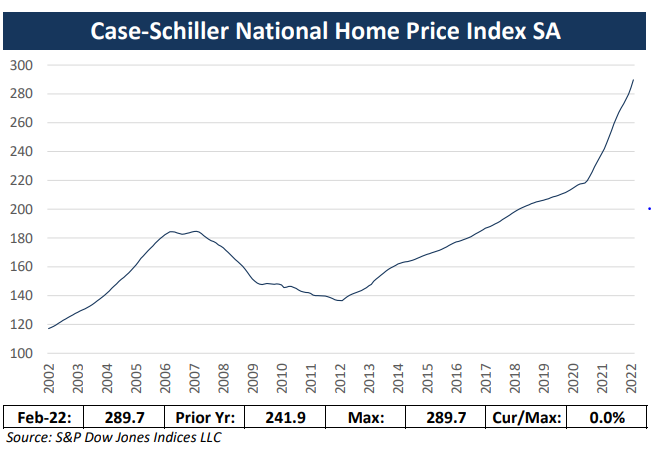
It does highlight an intuitive, yet alarming trend of decreasing affordability, which is the lowest it has been since we emerged from the great financial crisis (GFC). This is a combination of higher mortgage rates, topping 5% for the first time also since the GFC, but more so the rise in home prices, as seen in the following Case Schiller Home Price Index chart.3
Another interesting way to look at affordability would be the ratio of home prices to income. Today we stand at 4.3x, significantly above the historical range of 2.3-3x, and another indication of how unaffordable housing has become.
As clients think about whether we are on the brink of another housing crisis, it is helpful to compare metrics of today’s market dynamics versus that of 2006.
a) Level of mortgage rates – while rates have moved up significantly in the last six months, today the rate is north of 5%, which is still lower than the rates seen in the 2006-2008 time frame. However, with the prospect of rates moving higher and the speed at which rates have risen thus far, this is something to watch. In addition, the percentage of 30 year fixed rates to variable rate structures is materially higher (better) than back then.
b) Underwriting standards – underlying standards have improved, driven by higher overall FICO credit scores, lower loan to value (LTV), and stricter dependency on metrics such as income verification. A few items to watch still include increasing loans to sub-prime customers and higher numbers of loans with less than 20% down.
c) Household debt – while there are several ways to measure consumer debt, the ratio of household debt to disposable income highlights a healthy consumer, especially compared to the last housing crisis. It will be important to watch how current persistent inflation puts additional pressure on this measure.
April housing numbers point to a weakening market with new single family home sales plunging about 17% month over moth and almost 27% year over year. The Pending Home Sales Index, a leading indicator of new home sales, dropped for the sixth consecutive month.
While there are good reasons to be believe that today’s housing market will not be anything like it was in 2006-2008, it is easy to point to housing as a potential area of excess. It will remain a complicated topic, but one we continue to watch closely as housing touches so many aspects of the economy.
1 Top Chart Source: National Association of Realtors; Bottom Chat Source: U.S. Census Bureau
2Chart Source: National Association of Realtors
3Chart Source: S&P Dow Jones Indices LLC

