
What is the Yield Curve and what is a Normal Curve versus an Inverted Curve?
The yield curve is a graph in which the yield of fixed income securities is plotted against the length of time until the securities mature. In the chart below, we are using U.S. Treasury bonds as an example. The X (horizontal) axis represents the time horizon for a bond maturity; starting with 1 month on the left and increasing to 30 years on the right. The Y (vertical) axis represents the bond yield and begins with 0% at the bottom and moves to 4% at the top. The two lines are a set point in time.
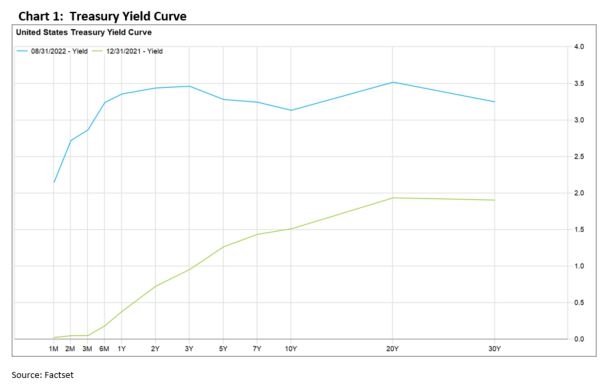
The green line below is an example of a normal yield curve. Bonds with shorter time horizons on the left pay lower rates, and rates increase as the time horizon grows to the right. This is a typical curve because normally an investor would expect to be paid a higher rate of interest for holding a bond for a longer period of time.
An inverted curve looks like the blue line below. A common definition of an inverted yield curve is when the spread between 2 year bonds and 10 year bonds is negative. You will note that as of 8/31/22, the 2 year U.S. Treasury bond is paying a higher rate than the 10 year U.S. Treasury bond.
Why is the yield curve inverted?
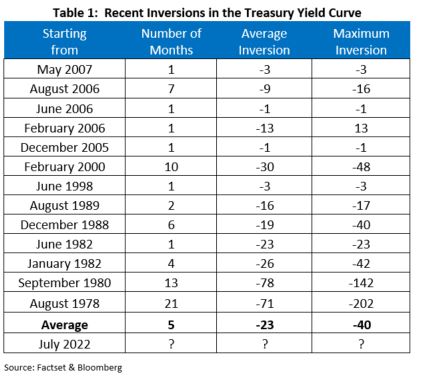
While a positively sloped yield curve occurs the majority of the time, the curve inverts more frequently than you might think. As shown in Table 1 below, since 1976 the yield curve has been inverted for 31 of 561 months or 5.5% of the time. On average, the yield curve has remained inverted for 5 months with an average inversion of 23 basis points (.23%).
Investors today debate whether the yield curve has inverted due to the fact that near term inflation expectations are significantly higher than long run inflation expectations, or whether the Federal Reserve will raise the Federal Funds rate too far too fast and push the U.S. economy into a recession.
Does this mean we are in a recession and what does that mean for the markets?
The inverted yield curve by itself does not mean we are in a recession. There are many factors that determine whether or not the economy is in a recession; for instance, declines in employment, real income or industrial production.
While the inverted yield curve has historically inverted 20 months prior to the start of a recession, this does not necessarily suggest a negative return environment in the near term. As shown in Table 2, both stocks (S&P 500) and bonds (Bloomberg US Govt /Credit Index) have historically experienced positive returns from the beginning of 2 Year / 10 year inversion to the start of a recession. Stocks have provided positive returns in three of the past four yield curve inversions averaging an increase of 7.6%, whereas bond returns have been positive in all four of the past yield curve inversions with an average increase of 8.9%. While there has been a long-term historical relationship between the stock market and the economy, they can move in widely different directions over shorter time periods.

How does this impact my portfolio?
While an inverted yield curve is likely a new phenomenon for some, we have managed through this before and will do so again in the future. The bond ladders we utilize in fixed income portfolios have relatively short average maturities and are therefore only marginally impacted by the yield curve inversion. We follow a variety of leading and current economic indicators to monitor the health of the U.S. and global economy and build investment strategies that perform well in a variety of economic and market scenarios. We remain focused on clients’ long-term goals and believe adhering to a well thought out financial plan is the best strategy for any economic or market environment.

