
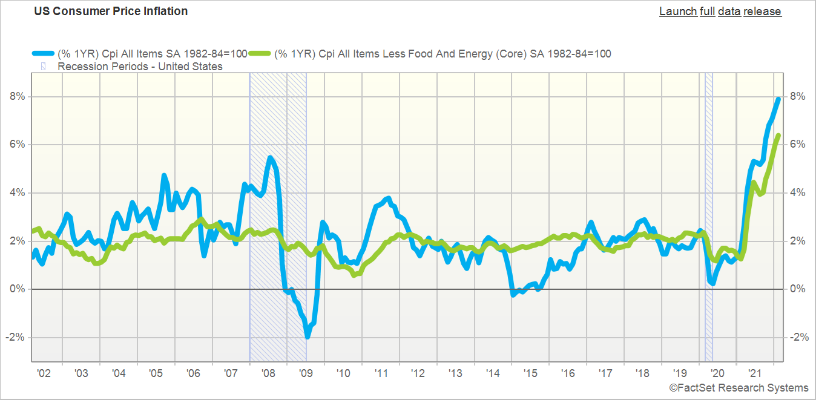
Inflationary indicators showed no slowdown in March, with consumer prices climbing 1.2%, pushed higher by rising oil prices resulting from the Russia-Ukraine war. As of the close on Friday, April 14 crude oil prices, which had fallen in recent weeks, reversed course, climbing more than $8.00 per barrel.
When we break down the components of inflation we see that shelter (housing) and cars are the two major contributors. These two areas may not necessarily affect the day to day lives of most people. You could even argue that housing inflation is good for home owners. That leaves energy, food, leisure (restaurants, hotels, etc.) and other which includes household furnishing, apparel and medical care.
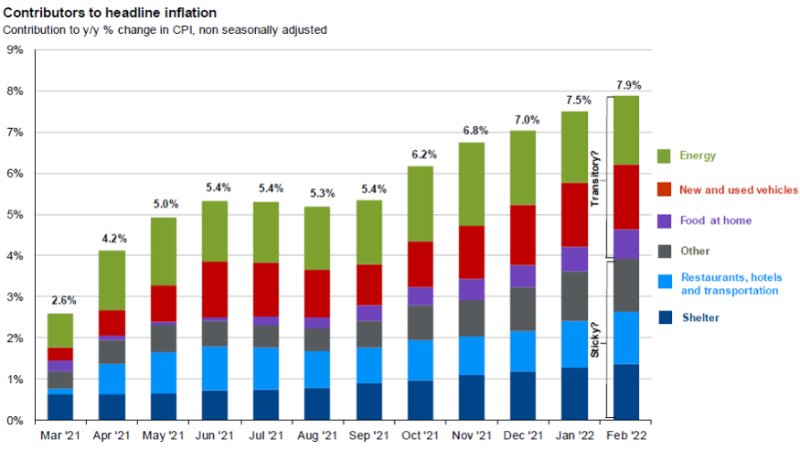
Source: BLS, J.P. Morgan Asset Management. Contributions mirror the BLS methodology on Table 7 of the CPI report. Values may not sum to headline CPI figured due to rounding and underlying calculations. “Shelter” includes owners equivalent rent and rent of primary residence. “Other” primarily reflects household furnishings, apparel and medical care services.
Guide to the Markets – U.S. Data are as of March 31, 2022.
Energy and food are the two areas that people are feeling inflation the most. We all experience this at the gas pump and in the grocery store (1.0% increase in March). When you look even deeper you find that a large portion of the increase in food prices is actually a result of fuel costs (18.3% increase in March) for transportation. Over the past 12 months, producer prices (the prices at which businesses sell their products or services to others) have moved up 11.2%, the largest increase since data was first calculated in November 2010. As with consumer prices, much of the increase in producer prices in March is attributable to a jump in energy prices.
Some of the reasons that inflation may stay high would include if the war in Ukraine continues for an extended period. Under this scenario fuel supply disruptions may not be resolved quickly and food prices could continue to increase since Ukraine is a major food producer. Another risk would be new Covid-19 outbreaks, similar to what China is experiencing right now, which interrupts supply lines.
However, there are some reasons to be optimistic that inflation could go down from here. Gas prices are down from their March peak and Core inflation (inflation with the removal of food and energy) increased at a slower rate in March than prior months - higher prices tend to dampen spending which means less demand. Covid-19 rates are decreasing around the world so supply lines should open up. Oil and gas market supply should adjust over time. While it may seem unlikely near term, the war could, and hopefully will find an end. We will continue to watch these inflationary factors as it remains a fluid situation with the outcome unknown. Our focus holds steady on positioning our portfolios to focus on the long term objectives despite the potential for short term volatility.
Data sources: Economic: Based on data from U.S. Bureau of Labor Statistics (unemployment, inflation); U.S. Department of Commerce (GDP, corporate profits, retail sales, housing); S&P/Case-Shiller 20-City Composite Index (home prices); Institute for Supply Management (manufacturing/services). Performance: Based on data reported in WSJ Market Data Center (indexes); U.S. Treasury (Treasury yields); U.S. Energy Information Administration/Bloomberg.com Market Data (oil spot price, WTI, Cushing, OK); www.goldprice.org (spot gold/silver); Oanda/FX Street (currency exchange rates). News items are based on reports from multiple commonly available international news sources (i.e., wire services) and are independently verified when necessary with secondary sources such as government agencies, corporate press releases, or trade organizations. All information is based on sources deemed reliable, but no warranty or guarantee is made as to its accuracy or completeness. Neither the information nor any opinion expressed herein constitutes a solicitation for the purchase or sale of any securities, and should not be relied on as financial advice. Forecasts are based on current conditions, subject to change, and may not come to pass. U.S. Treasury securities are guaranteed by the federal government as to the timely payment of principal and interest. The principal value of Treasury securities and other bonds fluctuates with market conditions. Bonds are subject to inflation, interest-rate, and credit risks. As interest rates rise, bond prices typically fall. A bond sold or redeemed prior to maturity may be subject to loss. Past performance is no guarantee of future results. All investing involves risk, including the potential loss of principal, and there can be no guarantee that any investing strategy will be successful.
The Dow Jones Industrial Average (DJIA) is a price-weighted index composed of 30 widely traded blue-chip U.S. common stocks. The S&P 500 is a market-cap weighted index composed of the common stocks of 500 largest, publicly traded companies in leading industries of the U.S. economy. The NASDAQ Composite Index is a market-value weighted index of all common stocks listed on the NASDAQ stock exchange. The Russell 2000 is a market-cap weighted index composed of 2,000 U.S. small-cap common stocks. The Global Dow is an equally weighted index of 150 widely traded blue-chip common stocks worldwide. The U.S. Dollar Index is a geometrically weighted index of the value of the U.S. dollar relative to six foreign currencies. Market indexes listed are unmanaged and are not available for direct investment.
IMPORTANT DISCLOSURES
Broadridge Investor Communication Solutions, Inc. does not provide investment, tax, legal, or retirement advice or recommendations. The information presented here is not specific to any individual's personal circumstances. To the extent that this material concerns tax matters, it is not intended or written to be used, and cannot be used, by a taxpayer for the purpose of avoiding penalties that may be imposed by law. Each taxpayer should seek independent advice from a tax professional based on his or her individual circumstances. These materials are provided for general information and educational purposes based upon publicly available information from sources believed to be reliable — we cannot assure the accuracy or completeness of these materials. The information in these materials may change at any time and without notice.

