Top Themes of the Month:
〉 The economy has made a remarkable recovery from the depths of the pandemic, but there is still a long way to go to get back on the pre-pandemic path
〉 Employment supply and demand mismatch – Americans can’t find a job, employers can’t find workers
Since the Covid-19 pandemic hit and sent us all into a tailspin, the economy has made a remarkable recovery, but we still have a ways to go to reestablish the economy’s previous growth trend. Some economic indicators show an optimistic outlook, while others are trailing behind. Take the Gross Domestic Product (GDP) rate for example, it rose 6.4% in the first quarter in 2021 compared to its steep record decline of 31.7% in the second quarter of 2020.1 If the trend from before the pandemic had continued, then our GDP rate would be higher than it is now. Forecasts show improvement however, with second quarter GDP expected to be as high as 10%. The downside to this explosive growth towards our old trend line is the potential for fear that it will drive higher inflation. Some inflation is good, but too much can be detrimental to the economy so it is important to keep this in check.
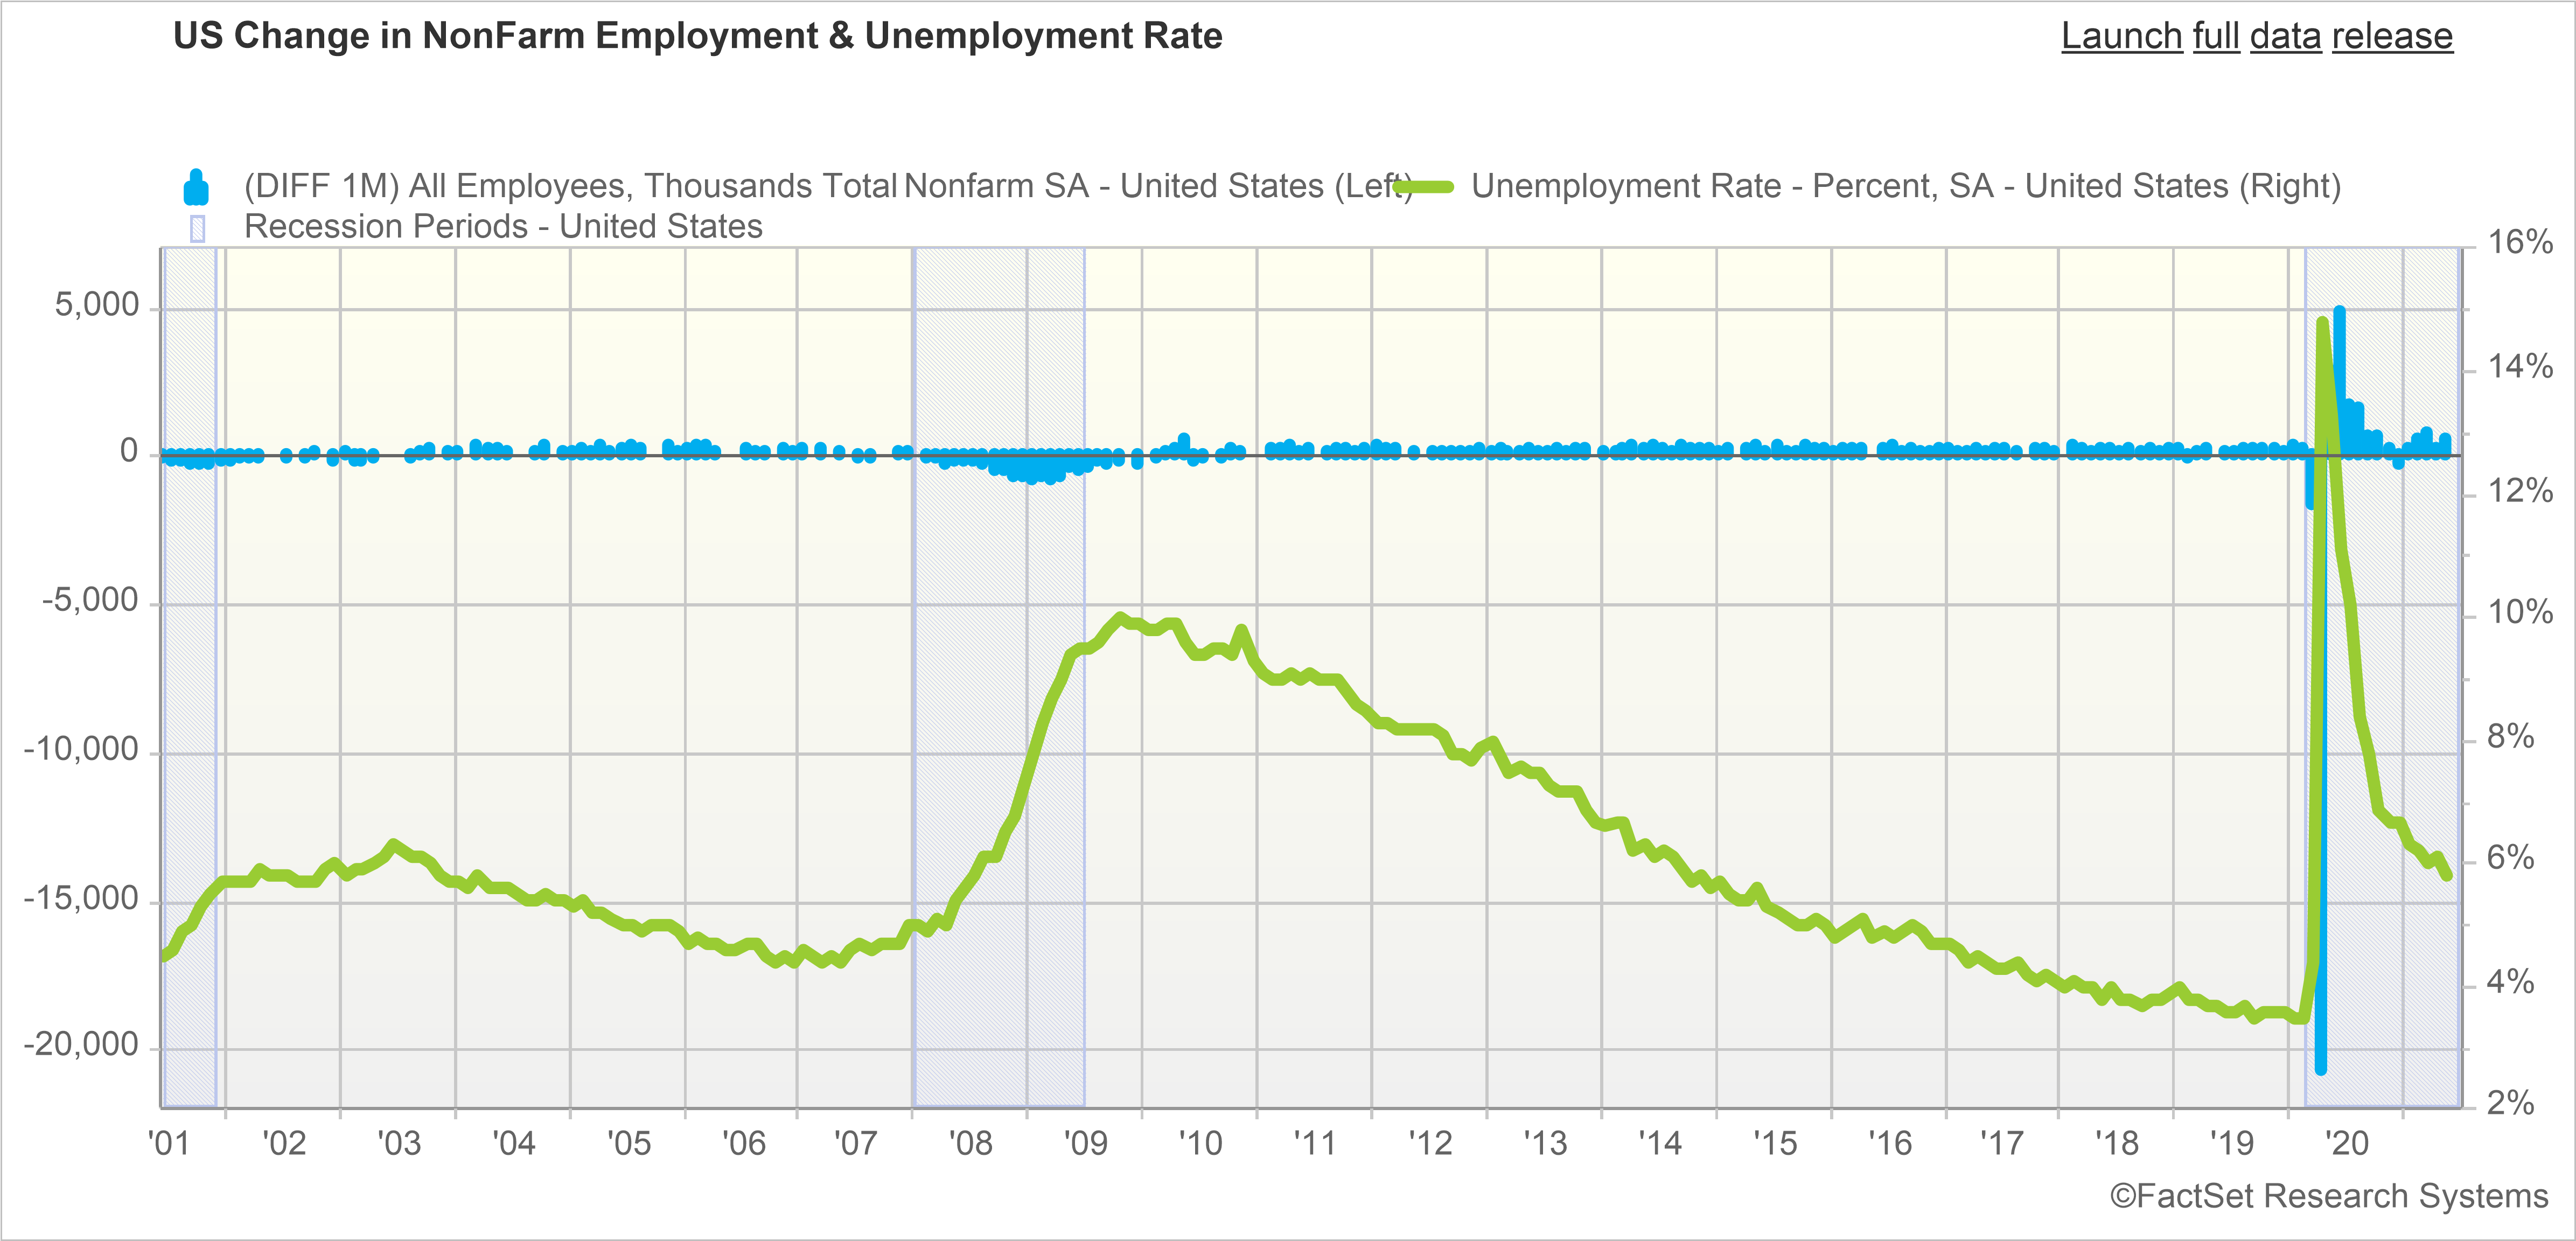
The unemployment rate skyrocketed and reached record highs during the pandemic, and while it has come down almost as quickly, there is more work to be done. A year and half ago the unemployment rate was below 4% and currently the rate is just below 6%.2 Unemployment is an important economic indicator and is expected to take some time before it strengthens to pre-pandemic levels.
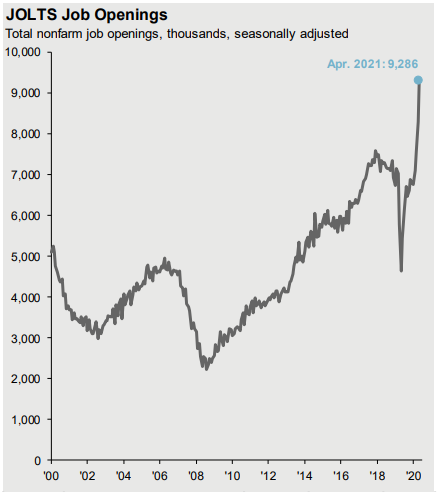
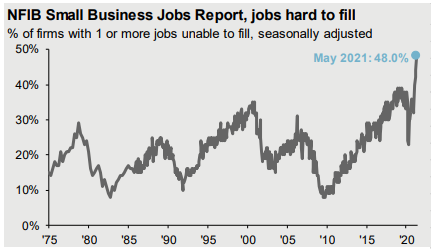
There has been a lot of discussion around the reasons for where the unemployment rate stands today. As we can see in the chart below3, job openings are rising, but 48% of small businesses are reporting at least one job that they cannot fill . Despite the increase in job gains and the drop in unemployment insurance claims, the rate of unemployment still remains higher than pre-pandemic levels.
One of the reasons for this employment supply and demand imbalance may be a mismatch of needed skills and geographic locations. During and coming out of the pandemic, certain areas of the economy have flourished (i.e. information technology) and others have suffered (i.e. restaurants). When there are job losses in one area and new jobs added in a different area, it can take time before people seize these opportunities and move to where the new jobs are, be it a different location or different area of expertise. The system will find its equilibrium again, but it may take some time.
Click
HERE to watch Rachael Aiken, CFP® Vice President and Portfolio Manager on Yahoo Finance discussing the June jobs report.
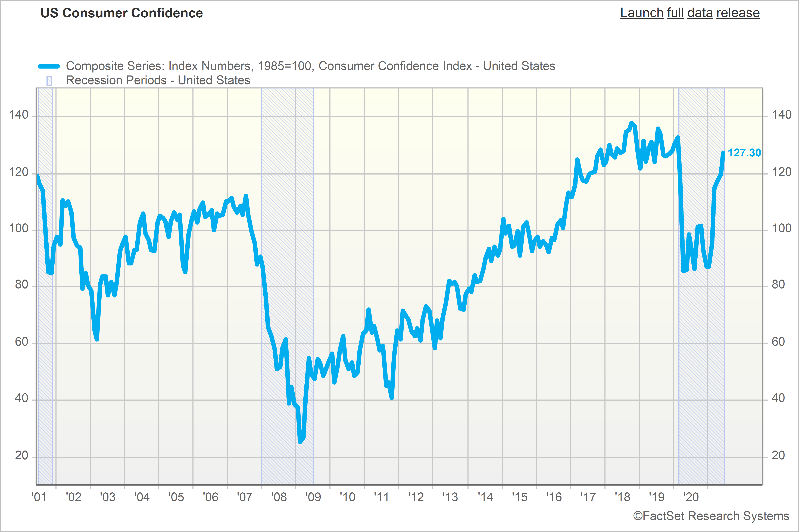
With all of the unknowns around the pandemic, consumer confidence took an initial dip, but interestingly it did not sink as low as it did during the financial crisis in 2008-2009. Currently, it has rebounded back to where it was in 2019.4
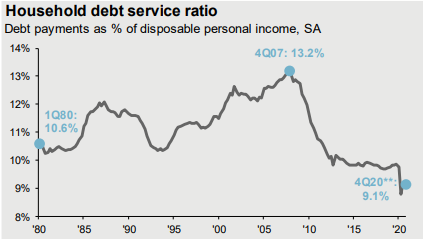
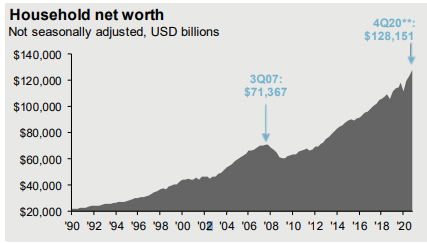
We are seeing positive Consumer Confidence due in part to the fact that we are experiencing the lowest level of Household Debt in 40 years (below) and an all-time high in Household Net Worth (below Household Debt). For many households their post pandemic financial life includes a low amount of debt and higher net worth. This combined with the desire to get back to the way things were, has resulted in increased spending and confidence looking forward.
While we are seeing positive economic growth with pent-up demand re-emerging from the restricted nature of the pandemic, the pace has slowed. We may also continue to see supply and demand disruptions but have seen a resilient consumer.
When looked at holistically – market surges combined with disruptions that impact the ability of the economy to run smoothly – we are reminded that a long term investment focus is key to success. No one could have expected the pandemic and markets collapse under that stress. Holding firm to a strategic, long-term approach to investing can help to create positive outcomes for your portfolio.
For additional insights from IMG experts,
please visit our website’s
Insights page and follow us on
LinkedIn.
1 Source: BEA; FactSet
2 Chart Source: FactSet
3 JOLTS Job Openings and NFIB Small Business Chart Source: Conference Board, National Federation of Independent Business, U.S. Department of Labor, J.P. Morgan Asset Management. Guide to the Markets – U.S. Data are as of June 30, 2021
4 US Consumer Confidence Chart Source: FactSet
5 Household debt service ratio and Household net worth chart source: BEA. Data include households and nonprofit organizations. SA – seasonal adjusted. *Revolving includes credit cards. Values may not sum to 100% due to rounding. **4Q20 figures for debit service ratio and household net worth are J.P. Morgan Asset Management estimates. Guide to the Markets – U.S. Data are as of December 31, 2020.
Not Insured by FDIC or Any Other Government Agency / Not Rockland Trust Guaranteed / Not Rockland Trust Deposits or Obligations / May Lose Value

