Top Theme of the Month:
-
Longer term earnings expansion is expected, but will it be impacted by shorter term economic movements
With the amazing surge in the markets, many are asking if we have come too far too fast. The S&P 500 is up over 90% off of last year’s bottom, while the average annual return this past century is closer to 10%. Another way to look at this is where we were before the pandemic. The S&P 500 level was close to 3,400 in February 2020 before losing one-third of its value in five weeks. At current levels, the S&P 500 is up over 30% from that prior peak in the last 18 months, which includes managing through the pandemic, the elections, and many other economic and social challenges.
In the long-run, stock prices tend to follow earnings. Looking at the S&P 500, the earnings for calendar year 2019 were roughly $157 per share, and although 2020 fell to $122 per share, the rebound in corporate profits this year have consensus analyst estimates for 2021 close to $196 per share, over 25% higher than 2019. This means that the big price move we have experienced in the last 18 months has fundamental support behind it. You can see the historical earnings over the last three decades and the estimates for 2021-2023 in the chart below.1 The future is always in motion. When last year ended, the projections for 2021 were closer to $164 per share, and corporate results have surpassed all expectations to bump those estimates closer to $200 per share now.
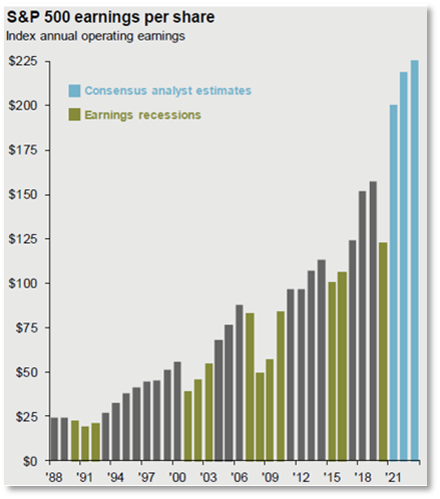
1Source: Computstat, FactSet, Standard & Poor’s, J.P. Morgan Asset Management. Historical EPS levels are based on annual operating earnings per share. Earnings estimates are based on estimates from FactSet Market Aggregates. Past Performance is not indicative of future returns. Guide to the Markets – U.S. Data are as of August 11, 2021.
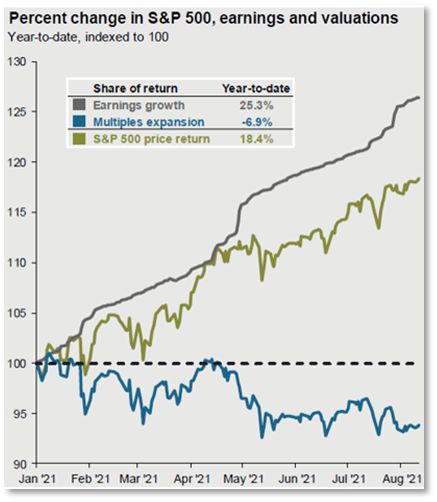
We can see this illustrated in this chart2 which shows what has happened in more detail. The earnings estimates for 2021 have climbed over 25% since the year began, driving an 18% price return. The market, as measured by the P/E (price/earnings) ratio has become cheaper in 2021. The higher the P/E ratio, the more expensive the price is for the earnings received.
Although further earnings expansion is expected into 2022 and 2023, we have all seen that even the short-term future is anything but predictable. There will be debates about infrastructure spending, disconnects in the job market, inflation resiliency, and possible increases in tax rates for individuals and corporations as we move forward. At Rockland Trust, we are not trying to help you navigate the next ten weeks, but the next ten years. If there are recent changes in your financial situation it might be a good time to visit with your advisor team.
Click HERE to listen to Doug Butler, CFA, CFP® Senior Vice President
and Director of Research on WTIC talk radio Mornings with Ray and Brian
about the recent jobs numbers and the economy.
For additional insights from IMG experts,
please visit our website’s Insights page and follow us on LinkedIn.
*All statistical data reflected herein is sourced via S&P
2 Source: Computstat, FactSet, Standard & Poor’s, J.P. Morgan Asset Management. Historical EPS levels are based on annual operating earnings per share. Earnings estimates are based on estimates from FactSet Market Aggregates. Past Performance is not indicative of future returns. Guide to the Markets – U.S. Data are as of August 11, 2021.
Not Insured by FDIC or Any Other Government Agency / Not Rockland Trust Guaranteed / Not Rockland Trust Deposits or Obligations / May Lose Value