
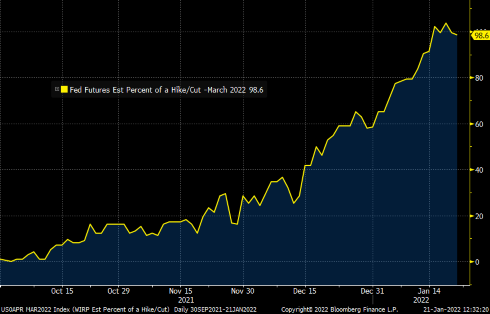
 The long awaited removal of liquidity is upon us as the Federal Reserve gears up to start increasing rates this year and beyond. If this was highly anticipated, why the recent commotion in the markets? What at least feels different is the pace and magnitude by the Fed, just a month after their rate hike announcement during the December 2021 meeting. The probability for a rate hike in March has increased substantially. In addition, the capital markets have already reacted with the yield on the US Treasury note rising from 1.4% to about 1.9%. With this type of rapid rate change, expectations have changed so quickly, as this chart1 reflects.
The speed at which the rates increase has a direct effect on the decrease in multiples that investors pay for assets in the market. This is the case because the stock market is essentially one large, presumably carefully calibrated discounted cash flow (DCF). In that DCF, investors discount back future cash flows at a rate commensurate with characteristics of the business such as revenue and profit growth rate, capital intensity, and overall riskiness of the business. The discount rate is directly related to, amongst other things, what we view as the risk free rate (commonly referred to today as 10 year treasury yield). Confidence in interest rates moving higher and discernibly higher cause those cash flows to be discounted back at a higher rate, making the present value worth less, and sometimes much less. This all equals lower multiples, like P/E (price-to-earnings) multiples. One has to remember that this is all else equal, meaning nothing else changes with other variables (a key assumption).
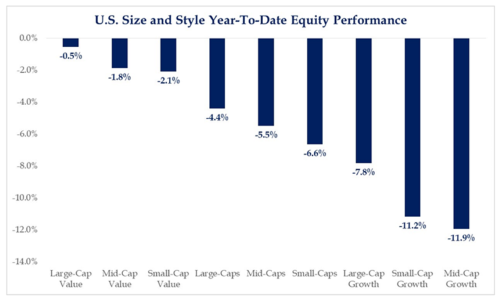
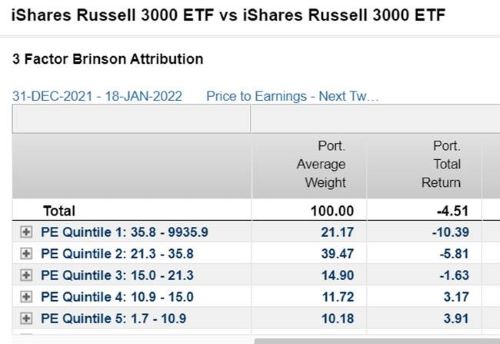
This leads to a popular topic among investors – market rotation and more specifically, value vs. growth. In this recent period of rapid rate increases, growth stocks have been more severely punished than value stocks, which in part makes sense as their multiples are typically higher than value stocks to start with, so they simply have more room to go down. The decline, which can be seen in these two charts, seems fairly linear, almost algorithmic. The chart on the left2 highlights the difference in size and style, while the chart on the right3 breaks it down by price-to-earnings ratio (P/E), all highlighting better performance the “cheaper” you are.
The rather systematic performance may indicate that the market is trying to properly discriminate from the growth companies that are more immature and conceptual in nature from the truly established franchises with profits and strong business models that trade at higher multiples. However, in these market corrections, there may be a few of the latter that become opportunities for long term investors.
An important consideration in all this is why are rates moving higher, and is that a good or bad thing? Typically it means that the underlying economy is doing better. While that could be the case, today it may also be more about battling raging inflation and getting back to a more “normal” interest rate environment given the good economy.
The main point is that the theoretical discounted cash flow cannot be “all else equal.” There are going to be other assumptions changing, and these are the items that we will be watching for and evaluating to see if this recalibration makes sense and where this correction provides opportunity.
1 Source: Bloomberg
2 Source: Strategas
3 Source: Factset

